Pages

Wednesday, March 27, 2013

AWS VPC NAT Instance Failover and High Availability

Amazon Virtual Private Cloud (VPC) is a great way to setup an isolated portion of AWS and control the network topology. It is a great way to extend your data center and use AWS for burst requirements. With the latest VPC for Everyone announcement, what was earlier "Classic" and "VPC" in AWS will  soon be only VPC. That is, every deployment in AWS will be on a VPC even though one might not need all the additional features that VPC provides. One might eventually start looking at utilizing VPC features such as multiple Subnets, Network isolation, Network ACLs, etc.. Those who have already worked with VPC's understand the role of NAT Instance in a VPC.

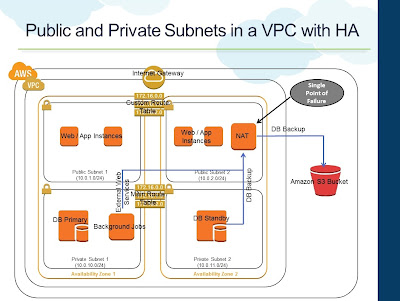
When you create a VPC, you create them with multiple Subnets (Public and Private). Instances launched in the Public Subnet have direct internet connectivity to send and receive internet traffic through the internet gateway of the VPC. Typically, internet facing servers such as web servers are kept in the Public Subnet. A Private Subnet can be used to launch Instances that do not require direct access from the internet. Instances in a Private Subnet can access the Internet without exposing their private IP address by routing their traffic through a Network Address Translation (NAT) instance in the Public Subnet. AWS provides an AMI that can be launched as a NAT Instance. Following diagram is the representation of a standard VPC that gets provisioned through the AWS Management Console wizard.
Standard Private and Public Subnets in a VPC
The above architecture has
  • A Public Subnet that has direct internet connectivity through the Internet Gateway. Web Instances can be placed within the Public Subnet
  • The custom Route Table associated with Public Subnet will have the necessary routing information to route traffic to the Internet Gateway
  • A NAT Instance is also provisioned in the Public Subnet
  • A Private Subnet that has outbound internet connectivity through the NAT Instance in the Public Subnet
  • The Main Route Table is by default associated with the Private Subnet. This will have necessary routing information to route internet traffic to the NAT Instance
  • Instances in the Private Subnet will use the NAT Instance for outbound internet connectivity. For example, DB backups from standby that needs to be stored in S3. Background programs that make external web services calls
Of course, the above architecture has limited High Availability since all the Subnets are created within the same Availability Zone. We can avoid this by creating multiple Subnets in multiple Availability Zones.
Availability Zones
Public and Private Subnets with multiple Availability Zones

  • Additional Subnets (Public and Private) are created in one another Availability Zone
  • Both Private Subnets are attached to the Main Routing Table
  • Both Public Subnets are attached to the same Custom Routing Table
  • Instances in the Private Subnet still continue to use the NAT Instance for outbound internet connectivity
Though we increased the High Availability by utilizing multiple Availability Zones, the NAT Instance is still a Single Point of Failure. NAT Instance is just another EC2 Instance that can become unavailable any time. The updated architecture below uses two NAT Instances to provide failover and High Availability for the NAT Instances
NAT Instance High Availability
  • Each Subnet is associated with its own Route Table
  • NAT1 is provisioned in Public Subnet 1
  • NAT2 is provisioned in Public Subnet 2
  • Private Subnet 1's Route Table (RT) has routing entry to NAT1 for internet traffic
  • Private Subnet 2's Route Table (RT) has routing entry to NAT2 for internet traffic
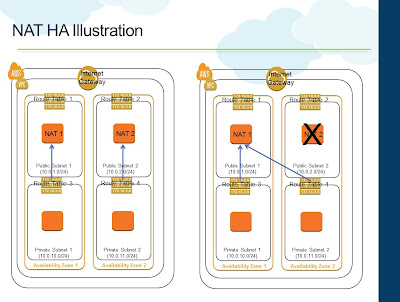
NAT Instance HA Illustration

A script can be installed on both the NAT Instances to monitor each other and swap the routing table association if one of them fails. For example, if NAT1 detects that NAT2 is not responding to its ping requests, it can change the Route Table of Private Subnet 2 to NAT1 for internet traffic. Once NAT2 becomes operational again, a reverse swapping can happen. AWS has a pretty good documentation on this and a sample script for the swapping.

Apart from HA, the above architecture also provides better overall throughput, since during normal conditions, both NAT Instances can be used to drive the outbound internet requirements of the VPC. If there are workloads that requires a lot of outbound internet connectivity, having more than one NAT Instance would make sense. Of course, you are still limited with one NAT Instance per Subnet.

Monday, February 18, 2013

Log Analysis and Archive with Amazon S3 and Glacier - Full Summary

Logging is an essential component of any system and helps you understand what's really going on in the system. Just like how you build systems that can scale, perform performance tweaks, design caching architecture, logging is an area that requires that special care to effectively collect logs and make some meaning out of it.

In the Cloud, and more specifically in AWS, there are numerous options and considerations with respect to logging such as
  • What are the different sources from where you can collect logs
  • How do you collect logs from a dynamic infrastrucuture
  • How effectively logs can be collected without affecting the performance of the system
  • What are the different storage options available
  • And most importantly how one can do it cost effectively
When I set to write on this, I understood that it is going to be a lengthy article with many areas being covered. And logging is an area whose importance is understood only when things go wrong. Otherwise it is pretty boring :) So I decided to split my thoughts in to multiple posts and had been writing about it for the past one month. So this post is a summary of all those different posts.

The Introduction - this is the introductory post setting the context of the different areas that we are going to cover as part of this multi-part post

Part I - in this part, we define the log structure and look at how to collect logs from Amazon CloudFront, the Content Distribution Network service from AWS

Part II - this post describes on how to use the local storage of the EC2 Instance for logging

Part III - part III discusses on how to collect from multiple instances that are dynamically provisioned, how to rotate the log files and store them in a centralized log storage

Part IV - In this final post, we look at what different storage options are available  for cost effective logging, how one can use Glacier, the archival service from AWS, the best practices that one needs to remember and a list of third party / commercial log management solutions available in the market

I hope this of some use to you and provides some insights on logging in AWS. I would definitely like to hear any comments and alternative approaches towards this.

Monday, January 14, 2013

Log archive & analysis with Amazon S3 and Glacier - Part IV

We now have the logs coming from CloudFront, Web/App and Search tier to the centralized log storage in Amazon S3. In this final post of this series, let's now see what are the options at storage level from cost point of view and what to do with mountains of logs.

Using Reduced Redundancy Storage
Amazon S3 has different storage class - Standard, Reduced Redundancy Storage (RRS) and Glacier. By default when we create store any Object in Amazon S3, it is stored under the Standard storage class. Under "Standard" storage class, all Objects have 99.999999999% durability and 99.99% availability of objects over a given year. With RRS, the Objects that are stored in S3 are replicated at fewer locations to give 99.99% durability and 99.99% availability of objects over a given year. RRS comes cheaper than Standard storage. If we are storing 1TB of log files under Standard storage, it would cost about $95/month (in US-Standard region). Under RRS the same 1TB of storage would be $76/month.

The RRS option cannot be enabled at bucket level but rather at individual Objects level. We can enable RRS for the logs folders that we created through the Object properties

Enable S3 Reduced Redundancy Storage

Log Analysis
We can now initiate Elastic Map Reduce jobs to process these log files and produce log analytics. Elastic Map Reduce takes a S3 bucket as the input source location. We can point the "log" bucket as the input source and supply a Map-Reduce implementation to EMR to crunch the logs.

Yearly Analysis / Multi Year Analysis
Certain requirements want an on-off analysis to be performed at the end of an year. For example, we may perform monthly or on-demand analysis of the log data regularly. And at the end of an year we may require an analysis against the entire year's data and compare it with previous years. For such cases, if we maintain multi-year log files in S3, the cost of storage might be very high. And previous year log files will be accessed only once in an year. For such reasons, we can archive the older log data to Amazon Glacier. Amazon Glacier provides low cost archival service for $0.01 per GB per month.

Archiving to Glacier
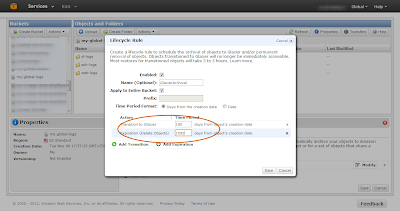
We will not be storing the log files forever. Typically any application will have a requirement to store log files for certain period of time beyond which they can be deleted. Let's say that we are interested in retaining only last 6 month's log files. And occasionally we might be doing one year or three years analysis. In such cases, we can use set Lifecycle policies in S3 to automatically archive to Glacier beyond a certain period of time. We can also instruct S3 to automatically deleted Objects beyond a certain period of time.
  • Click on the bucket properties and navigate to the "Lifecycle" tab
  • Click on "Add Rule" to create a new "Lifecycle Rule"
  • Specify that the rule needs to apply for the entire bucket and create a "Transition" and "Expiration" rule
  • Create a "Transition" rule specifying "180" days. This will automatically move files from the S3 bucket to Glacier after 180 days
  • Create an "Expiration" rule specifying "1095" days. This will delete the log files automatically from S3 or Glacier after 3 years
Lifecycle Rules to Archive to Glacier and Delete Log Files
With that the log files will get automatically archived to Glacier after 6 months (from creation) and will be deleted after 3 years. Once the log files are archived to Glacier, the storage class of these log files (objects) in S3 changes to Glacier indicating that they are being stored in Glacier.
S3 Storage Class for archived files
Restoring from Glacier
For our year end analysis, we will need the archived data in Glacier back in Amazon S3 so that we can run Elastic Map Reduce jobs against them to produce our year-end / multi-year analytics information.  We can do this through the AWS Management Console by
  • Right clicking the particular object (log file) whose storage class is Glacier (meaning it is archived) and "Initiate Restore"
  • Specify, how long we require the Object in S3 for us to perform the analysis and complete the request
Once this request is initiated, it normally takes around 3-4 hours for AWS to restore the object from Glacier to S3. The "Object Restoration" process can be done only at an individual object level. We will normally have large number of log files at the end of an year, and doing this way is not practically possible.

Restoring from Glacier programmatically
Restoring from Glacier is essentially a S3 operation and not a Glacier operation as it seems to be. We need to use the S3 API to initiate restoration

AmazonS3 s3Client = new AmazonS3Client(new BasicAWSCredentials("aws-access-key", "aws-secret-access-key"));
ObjectListing listing = s3Client.listObjects(new ListObjectsRequest()
             .withBucketName("my-global-logs")
             .withPrefix("web-logs/")); 

The first step is to list all the keys of the Objects that we want to restore. To do this, use the S3 ListObjects API call to list all the Objects. Few pointers while using this API
  • Specify the bucket name that we want to list. Also include a prefix if we are interested in restoring only a specific directory within that bucket. For example, if we are interested only in performing analysis against the web-logs and not others, we can specify as indicated above
  • Since a bucket can contain 1000's of Objects, S3's API does pagination when sending the response. Hence use the "isTruncated" method in the response "ObjectListing" to check if there are more Objects. If so, initiate further API calls to list till the end
  • Since we are listing the entire bucket, the call will result in keys for the directory also. Something like the following. Hence check for the key containing a file instead of a directory and keep adding such keys to a list (like performing a simple 'contains(".log")' check)
          web-logs/2012/
          web-logs/2012/12/
          web-logs/2012/12/10/
          web-logs/2012/12/10/i-7a3flcd3/
          web-logs/2012/12/10/i-7a3flcd3/tomcat.log
          web-logs/2012/12/10/i-9d9dedf2/
          web-logs/2012/12/10/i-9d9dedf2/01/
          web-logs/2012/12/10/i-9d9dedf2/02/
          web-logs/2012/12/10/i-9d9dedf2/03/

Once we have entire list of Object Keys to restore, the next step is to initate the restore process for all the Objects

RestoreObjectRequest requestRestore = new RestoreObjectRequest("my-global-logs", "<object-key>", <restoration-period>);
s3Client.restoreObject(requestRestore);

Once the above request is initiated for all the Objects, Amazon Glacier takes about 3-5 hours to restore the Objects and make it available in Amazon S3. We can then run Elastic Map Reduce jobs with all the required data.

Things to remember / consider
  • Archiving and Restoring are S3 operations and hence are part of S3 API
  • If you have data stored in Glacier that weren't archived from S3, then to restore them, you should use the Glacier API to initiate downloads. See the steps outlined in AWS documentation for downloading an archive
  • Restored objects by default are stored under "Reduced Redundancy Storage"
  • If you have millions of Objects in S3 that has to be transitioned to Glacier, be aware of the cost of restore requests. Eric Hammond has put across a very detailed analysis here
  • Glacier is designed for Archival Storage. Meaning, you do not access the data frequently and can wait for accessing the data. Any download request from Glacier, will take 3-5 hours before it is available. Hence carefully choose the archival policy. If you plan to retrieve the log data frequently, Glacier will not be right choice and will prove to be very expensive (since it is not designed for frequent retrieval)
Log Management Solutions
There are plenty for log management solutions that are available as a service and can be plugged in to existing applications and cloud environment.
  • Splunk is a widely used log management and monitoring solution. Splunk can be setup on a server and can be easily configured to start collecting data from web servers. A SaaS version is also available where the service is completely managed by Splunk
  • Loggly is another cloud based log management solution that is available as a service
  • There are also open source solutions available such as LogStash that can be customized for our needs
That brings to the end of this series on what I wanted to cover as part of log analysis using S3 and Glacier. Logging is an essential component in any system and in the era of Cloud Computing, a good log management solution will prove handy. Once the problems of scale and performance gets sorted out with the help of Cloud Computing, the immediate next need of any system would be to have an effective way to look at the system and analyse at scale. A log management solution will definitely prove handy.

Friday, December 28, 2012

Log archive & analysis with Amazon S3 and Glacier - Part III

A recap from the previous posts:
In this post, we will see how to push logs from the local storage to the central log storage - Amazon S3 and what the considerations are.

Amazon S3 folder structure
The logs are going to be generated throughout the day and hence we need to have a proper folder structure to store them in S3. Logs will be particularly useful to perform analysis such as a production issue or to find a usage pattern such as feature adoption by users/month. Hence it will make sense to store them by year/month/day/hour_of_the_day structure.

Multiple Instances
The web tier will be automatically scaled and we will have multiple Instances always running for High Availability and Scalability. So, even if we have logs stored hourly basis, we will be having log files with similar names from multiple Instances. Hence the folder structure needs to factor multiple Instances as well. The resultant folder structure in S3 will look something like this

Amazon S3 Log Folder Structure
Note in the above picture (as encircled) that we are storing "Instance" wise logs for every hour.

Log Rotation
Every logging framework will have an option to rotate the log files on size, date, etc...We will be periodically pushing the log files to Amazon S3 and hence it might make sense to say, rotate the log file every hour and push it to S3. But the downside to that is, we cannot anticipate the traffic to the web tier and that's the reason we have the web tier scaling automatically on demand. If there is a sudden surge in the traffic which may result in large log files generated, it will start filling up the file system eventually making the Instance unavailable. Hence it is better to rotate the log files by size.

Linux-logrotate
You can use the default logrotate available in Linux systems to rotate the log files on size. Logrotate can be configured to call a post script after the rotation to enable us push the newly rotated files to S3. A sample logrotate implementation will look like this:

Note: If you are using logrotate, make sure your logging framework isn't configured to rotate

/var/log/applogs/httpd/web {
        missingok
        rotate 52
        size 50M
        copytruncate
        notifempty
        create 644 root root
        sharedscripts
        postrotate
                /usr/local/admintools/compress-and-upload.sh web &> /var/log/custom/web_logrotate.log
        endscript
}


The above set of commands rotate the "httpd" log files whenever the size reaches 50M. It also calls a "postrotate" script to compress the rotated file and upload it to S3.

Upload to S3
The next step is to upload the rotated log file to S3.
  • We need a mechanism to access the S3 API from the shell to upload the files. S3cmd is a command line tool that is widely used and recommended for accessing all S3 APIs through the command line. We need to setup the CLI in the Instance
  • We are rotating by size but we will be uploading to a folder structure that maintains log files by the hour
  • We will also be uploading from multiple Instances and hence we need to fetch the Instance Id to store in the corresponding folder. Within EC2, there is an easy way to get Instance meta data. If we "wget" "http://169.254.169.254/latest/meta-data/" it will provide the Instance meta-data such as InstanceId, public DNS, etc.. For example if we "wget" "http://169.254.169.254/latest/meta-data/instance-id" we will get the current Instance Id
The following set of commands will compress the rotated file and upload them into the corresponding S3 bucket

# Perform Rotated Log File Compression
tar -czPf /var/log/httpd/"$1".1.gz /var/log/httpd/"$1".1

# Fetch the instance id from the instance
EC2_INSTANCE_ID="`wget -q -O - http://169.254.169.254/latest/meta-data/instance-id`"
if [ -z $EC2_INSTANCE_ID ]; then
echo "Error: Couldn't fetch Instance ID .. Exiting .."
exit;
else
        # Upload log file to Amazon S3 bucket
        /usr/bin/s3cmd -c /.s3cfg put /var/log/httpd/"$1".1.gz s3://$BUCKET_NAME/$(date +%Y)/$(date +%m)/$(date +%d)/$EC2_INSTANCE_ID/"$1"/$(hostname -f)-$(date +%H%M%S)-"$1".gz
fi
# Removing Rotated Compressed Log File
rm -f /var/log/httpd/"$1".1.gz

Now that the files are automatically getting rotated, compressed and uploaded to S3 there is one last thing to be taken care of.

Run While Shutdown
Since the web tier will automatically scale depending upon the load, Instances can be pulled off (terminated) when load decreases. During such scenarios, we might be still left with some log files (maximum of 50MB) that didn't get rotated and uploaded. During shutdown, we can have a small script, that will forcefully call the logrotate to rotate the final set of files, compress and upload.
stop() {
echo -n "Force rotation of log files and upload to s3 intitiated"
/usr/sbin/logrotate -f /etc/logrotate.d/web
exit 0
}

Use IAM
We need to provide Access Key and Secret Access Key to the S3cmd utility for S3 API access. Do NOT provide the AWS account's Access Key and Secret Access Key. Create an IAM user who has access to only the specific S3 bucket where we are uploading the files and use the IAM user's Access Key and Secret Access Key. A sample policy allowing access for the IAM user to the S3 log bucket would be

{
  "Statement": [
    {
      "Sid": "Stmt1355302111002",
      "Action": [
        "s3:*"
      ],
      "Effect": "Allow",
      "Resource": [
        "arn:aws:s3:::"
      ]
    }
  ]
}
Note:
  • The above policy allows the IAM user to perform all actions on the S3 bucket. The user will not have permission to access any other buckets or services
  • If you want to restrict further, instead of allowing all actions on the S3 bucket, we can allow only PutObject (s3:PutObject) for uploading the files
  • Through the above approach, you will be storing the IAM credentials on the EC2 Instance itself. An alternative approach is to use IAM Roles so that the EC2 Instance will obtain the API credentials at runtime
With that we have the web tier log files automatically getting rotated, compressed and uploaded to Amazon S3 and stored in a central location. We have access to log information by the year/month/day/hour and Instance-wise.

Wednesday, December 19, 2012

Log archive & analysis with Amazon S3 and Glacier - Part II

In the previous post, we saw how to configure logging in AWS CloudFront and start collecting access logs. Let's now move on to the next tier in the architecture - web/app. The following are the key considerations for  logging in web/app layer:
  • Local Log Storage - choosing the local storage for logging. Using a storage option that is sufficient, cost-effective and meets the performance requirement for logging
  • Central Log Storage - how do we centrally store log files for log analysis in future
  • Dynamic Infrastructure - how do we collect logs from multiple servers that are provisioned on demand
Local Log Storage
Except very few cases, EBS-backed Instances are the most sought after Instance type. They launch quickly and easier to build Images out of them. But they come with couple of limitations from logging perspective
  • Limited storage - EBS-backed AMIs that are provided by AWS or third-party providers come with limited storage. For example, a typical RHEL AMI comes with around 6GB of EBS attached as the root partition. Similarly Windows AMI come with 30GB EBS attached as C:\
  • Growing EBS - log files tend to grow faster. And it becomes difficult to grow the root EBS (or an additional EBS) as the log file sizes grow
  • Performance - any I/O operation on an EBS Volume is over the network. And it tends to be slower than local disk writes. Specifically for logging, it is always better to remove the I/O bottleneck. Otherwise lot of system resources could be spent towards logging
Every EC2 Instance comes with ephemeral storage. These are local storage directly attached to the host on which the Instance is running. Ephemeral storage do not persist between stop-start cycles of an Instance (EBS-backed) but they are available when the Instance is running and persist during reboots. There are couple of advantages of Ephemeral storage:
  • They are locally attached on the physical host on which the Instance runs and hence have better I/O throughput when compared to EBS Volumes
  • They come in pretty good size - for example a m1.large Instance comes with 850GB of ephemeral storage
  • And it comes free of cost - you aren't charged per GB or for any I/O operations on the ephemeral storage unlinke EBS
This makes ephemeral storage the ideal candidate for storing log files. For an EBS-backed Instance, the ephemeral storage is not mounted and readily available. Hence one needs to follow the following steps to start using the ephemeral storage for storing log files
  • The logging framework usually comes with a configuration file to configure logging parameters. The log file path needs to be configured to point to the ephemeral storage mount directory that we create below
  • All application related files (such as binaries, configuration files, web/app server) will be installed on the root EBS. Before the final AMI is created, the ephemeral storage needs to be setup and configured
  • Run fdisk to list all the storage devices that are mounted
fdisk -l
  • Created a directory such as "/applogs". This is the directory where the ephemeral storage will be mounted
mkdir /var/log/applogs
  • Mount the storage device in this directory using the "mount" command
mount /dev/xvdj /var/log/applogs
  • Add "fstab" entries so that the ephemeral storage is mounted in the same directory after stop/start or when new Instances are launched out of this AMI
/dev/xvdj  /var/log/applogs xfs defaults,noatime,nobarrier,allocsize=64k,logbufs=8 0 2
/dev/xvdj /var/log/applogs    ext3    defaults        0   0

The last step is essential especially from AutoScaling point of view. When AutoScaling launches new Instances, the ephemeral storage needs to be automatically mounted in the directory so that the application can start logging. Now, we can go ahead create the final AMI and launch Instances from them. The new Instances will have the ephemeral storage automatically mounted in the "/var/log/applogs" directory and applications can start storing the log files in them.

Friday, December 14, 2012

Log archive & analysis with Amazon S3 and Glacier - Part I

Since this would be a multi part article, here's an outline in terms of how the different parts will be arranged
  1. First we will set the context in terms of taking a web application and identifying the areas of log generation for analysis
  2. Next we will define the overall log storage structure since we have logs being generated from different sources
  3. We will then look at each tier and look at how logs can be collected, uploaded to a centralized storage, what are the considerations
  4. Finally, we will look at other factors such as cost implications, alternate storage options, how to utilize the logs for analysis

Let's take an e-commerce web application which has the following tiers
  • Content Distribution Network - a CDN to serve the static assets of the website. AWS CloudFront
  • Web/App Server running Apache / Nginx / Tomcat on Amazon EC2
  • Search Server running Solr on Amazon EC2
  • Database - Amazon RDS
The first three areas are the major source of log information. Your CDN provider will provide access logs in a standard format with information such as the edge location serving the request, the client IP address, the referrer, the user agent, etc...The web servers and search servers will write access logs, error logs and application logs (custom logging by your application).

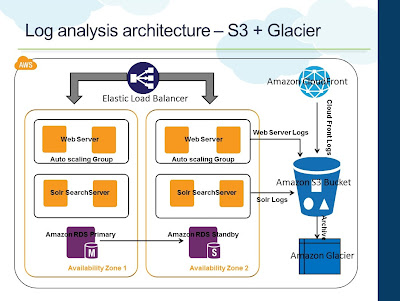
Log Analysis Architecture


In AWS, Amazon S3 becomes the natural choice for centralized log storage. Since S3 comes with unlimited storage and is internally replicated for redundancy, it will be the right choice for storing the log files generated by the CDN provider, web servers and search servers. Per above architecture, all of the above tiers will be configured/setup to push their respective logs to Amazon S3. We will evaluate each layer independently and look at how to setup logging and the different considerations associated.

S3 Log Storage Structure
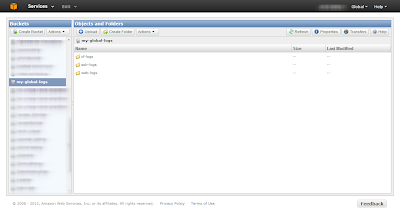
Since we have logs coming in front different sources, it is better to create a bucket structure to organize them. Let's say we have the following S3 bucket structure
S3 Log Storage Bucket Structure
  • my-global-logs: Bucket containing all the logs
  • cf-logs: Folder under the bucket for storing CloudFront logs
  • web-logs: Folder under the bucket for storing Web Server logs
  • solr-logs: Folder under the bucket for storing Solr Server logs

AWS CloudFront
AWS CloudFront is the Content Distribution Network service from AWS. With a growing list of 37 edge locations, it serves as a vital component in e-commerce applications hosted in AWS for serving static content. By using CloudFront, one can deliver static assets and streaming videos to users from the nearest edge location and thereby reducing latency, round trips and also off loading such delivery from the web servers.

Enable CloudFront Access Logging
You can configure CloudFront to log all access information during the "Create Distribution" step. You "Enable Logging" and specify the bucket to which CloudFront should push the logs.
Configure CloudFront for Access Logging

  • Specify the bucket that we created above in the "Bucket for Logs" option. This field will accept only a bucket in your account and not any sub-folders in the bucket
  • Since we have a folder called "cf-logs" under the bucket to store the logs, mention the name of that folder in the "Log Prefix" option
  • CloudFront will start pushing access logs to this location every hour. The logs will be in W3C extended format. The logs will be compressed by AWS since the original size could be significantly large for websites that attract massive traffic
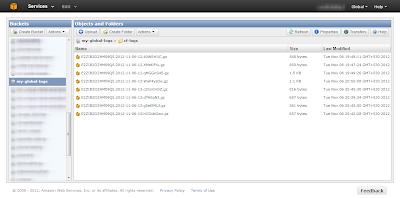
Once this is setup CloudFront will periodically start pushing access logs to this folder.
CloudFront Logs
CloudFront Logs
In the next post, we will see how to configure the web tier to push logs to S3 and what are the different considerations.

Tuesday, December 11, 2012

Log archive & analysis with Amazon S3 and Glacier - Introduction

Logging is an essential part of any system. It let's you understand what's going on in your system especially serving as a vital source for debugging. Primarily many systems uses logging to let developers debug issues in the production environment. But there are systems where logging becomes the essential component to understand the following
  • User Behavior - understanding user behavior patterns such as which areas of the system is being used by the user
  • Feature Adoption - evaluate new feature adoption by tracking how a new feature is being used by the users. Do they vanish after a particular step in a particular flow? Are people from a specific geography use this during a specific time of the day?
  • Click through analysis - let's say you are placing relevant ads across different pages in your websites. You would like to know how many users clicked them, the demographic analysis and such
  • System performance
    • Any abnormal behavior in certain areas in the system - a particular step in a workflow resulting in error/exception conditions
    • Analyzing performance of different areas in the system - such as finding out if a particular screen takes more time to load because of a longer query getting executed. Should we optimize the database? Should we probably introduce a caching layer?
Any architect would enforce logging as a core component in the technical architecture. While logging is definitely required, many a times, inefficient logging such as too much logging, using inappropriate log levels might lead to the following
  • Under performance of the system - the system could be spending more resources in logging than actively serving requests
  • Huge log files - generally log files grow very fast, especially when inappropriate log levels are used such as "debug" levels for all log statements
  • Inadequate data - if the log contains only debug information by the developer there will not be much of an analysis that can be performed
On the other hand, the infrastructure architecture also needs to support for efficient logging and analysis
  • Local Storage - how do you efficiently store the log files on the local server without running out of disk space; especially when log files tend to grow
  • Central Log Storage - how do you centrally store log files so that it can be used later for analysis
  • Dynamic Server Environment - how do you make sure you collect & store all the log files in a dynamic server environment where servers will be provisioned and de-provisioned on demand depending upon load
  • Multi source - handling log files from different sources - like your web servers, search servers, Content Distribution Network logs, etc...
  • Cost effective - when your application grows, so does your log files. How do you store the log files in the most cost effective manner without burning a lot of cash
In this multi-post article let's take up a case of a typical e-commerce web application with the above characteristics and setup a best practice architecture for logging, analysis and archiving in AWS. We will see how different AWS services can be used effectively to store and process the logs from different sources in a cost effective and efficient manner.